

President Joe Biden has been in office for one year today. But this post isn’t about him—not directly. This post is about all of America’s Presidents. (Yes, even that one. And that one.) On this anniversary, I decided to answer an interesting question…well, I thought it was interesting, anyway:
Which state has produced the most Presidents?
Well, that’s not a mystery. It’s Virginia. But that’s not the interesting part.
First of all, if you grew up in Ohio like I did, you may be thinking this is wrong. Ohio produced the most Presidents: eight Presidents, to be exact. And indeed, this is what I was taught. I had to take Ohio History in 4th grade and again in 7th grade, and we learned that eight of the 45 Presidents we’ve had (counting Cleveland only once) came from Ohio: both Harrisons, Grant, Hayes, Garfield, McKinley, Taft, and Harding. What’s going on, here?
It turns out that Ohio only produced the most Presidents if you cheat a little bit. Only seven of those eight Presidents were born in Ohio. One of them (William Henry Harrison) moved to Ohio from his birthplace in Virginia.
Speaking of, eight Presidents actually were born in Virginia: Washington, Jefferson, Madison, Monroe, W. H. Harrison, Tyler, Taylor, and Wilson. So Virginia wins, right?
Hang on, it’s a little more complicated than that.
Quick! What state is Joe Biden from? Biden was born in Scranton, Pennsylvania, but his primary residence when he was elected was in the state he represented in the Senate for 36 years: Delaware. Does this matter? Well, constitutionally, it’s the only thing that matters. The 12th Amendment to the US Constitution reads as follows:
“The Electors shall meet in their respective states and vote by ballot for President and Vice-President, one of whom, at least, shall not be an inhabitant of the same state with themselves…”
The Constitution doesn’t care what state a President was born in (as long as they were born in America). It cares what state they live in. The President and Vice President can’t be living in the same state, or else they get a penalty in the Electoral College. (If you’re my age or older, you may remember Dick Cheney hastily switching his residence from Texas to Wyoming before the 2000 election to avoid this.)
So the real question is, “Which state did the most Presidents live in?”
It turns out, the answer is neither Virginia nor Ohio. It’s New York.* Seven Presidents were affiliated with that state: Van Buren, Fillmore, Arthur, Cleveland, both Roosevelts, and Trump. By this standard, Ohio is bumped down to six. (Although that means it was tied with New York when I was growing up.) Ohio gained W. H. Harrison, but two of its native sons, Grant and B. Harrison, who moved out of Ohio before being elected. Virginia does even worse with W. H. Harrison, Taylor, and Wilson all moving away, leaving it with only five.
So the best Ohio can do is tie with Virginia. Virginia had the most Presidents born; New York had the most Presidents living there, and Virginia and Ohio are tied for the most Presidents born or living there.
Still, that’s a big chunk of Presidents. 21 of our 45 Presidents have come from just those three states in some capacity. Yet as I was considering this, I got to thinking: is it so remarkable that these three states produced so many Presidents? They’re all large states—not the largest, but they all were even bigger in the past as a fraction of the nation’s total population. In other words, the real question of this post is:
Which state has produced the most US Presidents relative to its population?
And it turns out, it’s Joe Biden’s Delaware.
Okay, let’s back up. As before, there are two ways we can answer this: by state of birth and by state of affiliation. Affiliation makes more sense, but let’s cover both because we can handle them in more or less the same way. How many Presidents would we expect each state to have produced over the course of the nation’s history, based on its population?
To figure this out, I took each President, calculated the percent of the US population of their home state in their of year decade of birth, and in their year decade of election. For the eight Vice Presidents who followed a President dying in office, I still counted them, but in the year they were elected Vice President, regardless of whether they won reelection (and again, counting only Cleveland’s first term). I don’t have data for every year, but I think every decade is good enough in this case. For years after 1785, this is easy; I could just round to the nearest Census. For birth years before 1785, it’s a little trickier, as there are no US Censuses to work with. Luckily, the US Census Bureau still has us covered. Way back at the beginning of the 20th century, they compiled a bunch of colonial censuses to recreate the decennial counts all the way back to 1610 (for the colonists, that is). You can see that here: https://www2.census.gov/prod2/decennial/documents/00165897ch01.pdf
With a bit of effort, you can use these data to compute the relative population of every state in every decade. If we assume the President is drawn from the population at random, we can add up each state’s chance of winning each election and compare it with the number of times each state has actually won the election. Of course, for many states, that number is zero, but for the ones that aren’t, we can see some interesting patterns.
You can see the whole thing in this Google Sheet. Click to go to the workbook.
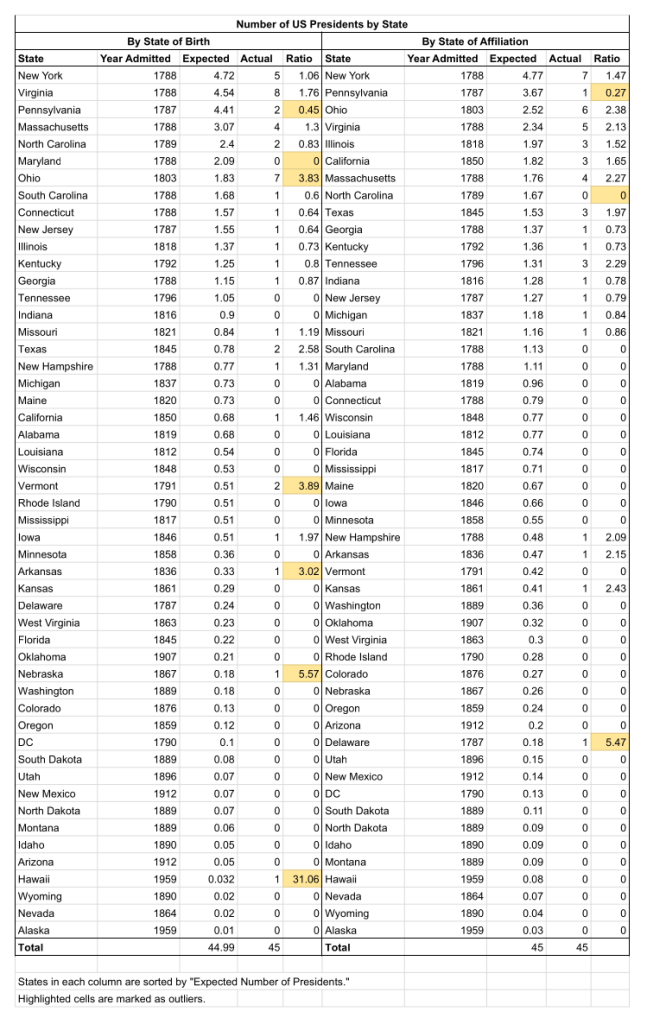
Let’s start with Presidents’ states of birth. To do this, we have to reach all the way back to the 1730 estimates, but it still works. In 1730, Virginia comprised 23% of the population of the Twelve Colonies (Georgia wasn’t founded until 1733). Therefore, approximately 60 years later, we would expect a Virginian to have a 23% chance of winning the 1788 election. Apply this to all 45 Presidents, and we’re good to go. So, which state has most outperformed its expectations?
The answer is Hawaii, by a huge margin. As the birthplace of Barack Obama, it has produced 31 times as many Presidents (one) as the expected value of 0.032, making it six times as successful as any other state.
Of course, this is just because of Hawaii’s very small population. Any small state that produces a President at all has beaten the odds. Nebraska (Ford) and Arkansas (Clinton) also have fairly high scores because of their small populations. It’s just the luck of the draw at that level.
It gets more interesting when we look at the large states. It turns out that by this metric, New York has only had an average performance: five Presidents expected and five Presidents produced. Virginia is doing a fair bit better, and Ohio is doing a lot better: seven Presidents to an expected two. In fact, Ohio is by far the most successful large state. (Maybe there was something to those Ohio History lessons, after all.)
Many states have had no Presidents to call their own, of course. But two outliers exist for the larger ones. Among the states that have historically had a large share of the population, we would expect Pennsylvania to have about four Presidents born there when it only produced two (Buchanan and Biden), and Maryland hasn’t produced any at all.
But as I said, a better metric for how successful a state is politically should be how many Presidents have been elected from it as residents. The main change here is that we need census numbers from six roughly decades later. The 45 Presidents were born between 1732 and 1961, but were elected between 1788 and 2020. This gives a big leg up to the younger states, which have competed in more elections than they were around for people to be born in. The modern-day powerhouses of California and Florida, both admitted in the mid-1800s, both jump more than ten spots on the “Expected” list, while small Eastern states like Maryland and New Hampshire drop by ten spots.
And if we look at the states where Presidents were actually elected from, we immediately see that things have much more evened out by population. Large states are better represented here. And this makes sense; large states have a larger talent pool to draw on and a larger impact on national politics that makes it easier for politicians to jump to the federal level. Sometimes, the parties break from the conventional wisdom, such as when Sarah Palin from bottom-of-the-list Alaska made it onto a major party ticket, but there’s a definite advantage for big states here.
The numbers are also more tightly distributed. Going by birth, the ratio of actual to expected Presidents almost always fell in the range of 0.6 to 4.0 (when it wasn’t zero). Now, that range is narrower, with almost all of them falling between 0.7 and 2.5.
So which state is the best at producing Presidents based on where they lived? Well, once again, any small state that manages to produce any President is going to get a leg up, and in this case, the highest number goes to Biden’s home state of Delaware, outperforming expectations by a factor of five and a half. Among the large states, the outliers are Pennsylvania, which now claims only one President (Buchanan) and North Carolina with zero. (Maryland is also still at zero, but it’s further down the list and less remarkable.)
Ohio, admittedly, is the most productive of the large states on both lists. Although the joke when I was growing up was that it didn’t have very good luck do it. Out of both Harrisons, Grant, Hayes, Garfield, McKinley, Taft, and Harding, only two of them (Grant and Taft) are really famous on the national stage, and four of them died in office—half of all Presidents who have. So…points for consistency, I guess?
*I should clarify that I’m using Wikipedia’s standard of “primary affiliation” here. I haven’t double check if this is actual state of residence at the time of election.
